Python Matplotlib - Subplot title
How to Add Titles to Subplots in Matplotlib
Adding titles to subplots in Matplotlib enhances the clarity and interpretability of your visualizations. This tutorial explains how to set titles for individual subplots and the entire figure.
Setting Titles for Individual Subplots
To set titles for subplots, use the set_title() method of the subplot's Axes object. Here's the syntax:
ax.set_title("Title String")
Example: Adding Titles to Subplots
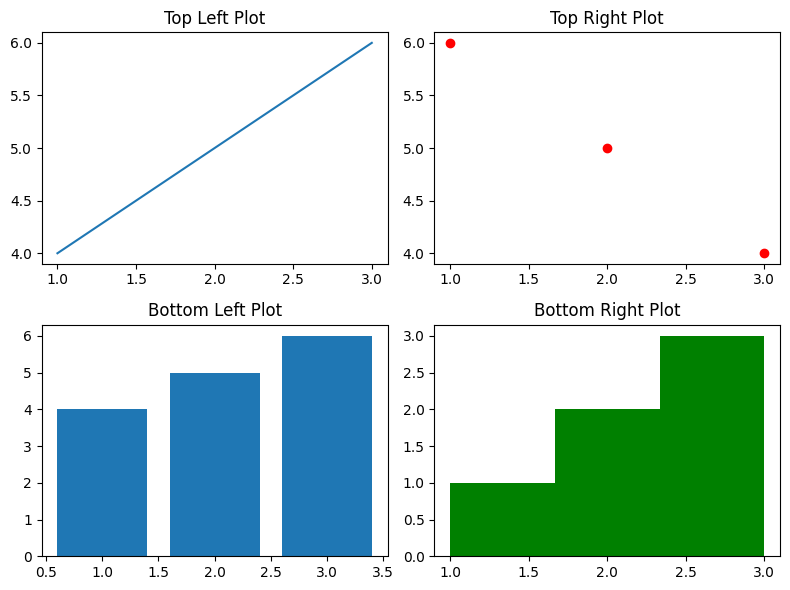
Let's create a figure with multiple subplots and assign titles to each.
import matplotlib.pyplot as plt

# Create subplots with 2 rows and 2 columns
fig, ax = plt.subplots(2, 2, figsize=(8, 6))

# Set titles for individual subplots
ax[0, 0].set_title("Top Left Plot")
ax[0, 1].set_title("Top Right Plot")
ax[1, 0].set_title("Bottom Left Plot")
ax[1, 1].set_title("Bottom Right Plot")

# Add data to subplots
ax[0, 0].plot([1, 2, 3], [4, 5, 6])
ax[0, 1].scatter([1, 2, 3], [6, 5, 4], color='r')
ax[1, 0].bar([1, 2, 3], [4, 5, 6])
ax[1, 1].hist([1, 2, 2, 3, 3, 3], bins=3, color='g')

# Adjust layout and display
plt.tight_layout()
plt.show()
Output

Setting a Title for the Entire Figure
To set a title for the entire figure, use the fig.suptitle() method. The syntax is:
fig.suptitle("Figure Title")
Example: Adding a Title to the Figure
import matplotlib.pyplot as plt

# Create subplots
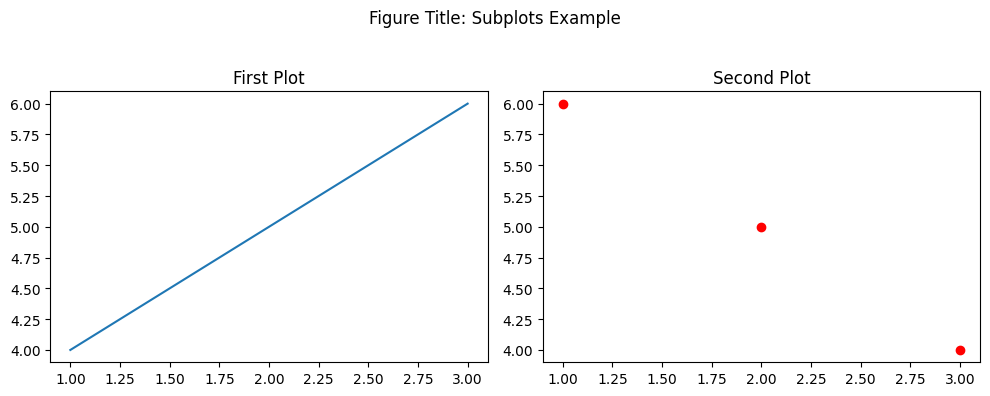
fig, ax = plt.subplots(1, 2, figsize=(10, 4))

# Add individual subplot titles
ax[0].set_title("First Plot")
ax[1].set_title("Second Plot")

# Add figure title
fig.suptitle("Figure Title: Subplots Example")

# Plot data
ax[0].plot([1, 2, 3], [4, 5, 6])
ax[1].scatter([1, 2, 3], [6, 5, 4], color='r')

# Adjust layout and display
plt.tight_layout(rect=[0, 0, 1, 0.95])
plt.show()
Output

Summary
In this tutorial, you learned how to:
- Use
set_title()to set titles for individual subplots. - Use
fig.suptitle()to set a title for the entire figure.
These techniques help make your plots more informative and visually appealing.