Python Matplotlib - Adjusting Spacing Between Subplots
Adjusting Subplot Spacing in Matplotlib
When creating multiple subplots in Matplotlib, it's essential to adjust the spacing between them to avoid overlapping labels, titles, and other plot elements. Matplotlib provides several methods to control subplot spacing, including tight_layout() and subplots_adjust(). This tutorial explores these methods with examples.
Key Methods for Adjusting Subplot Spacing
Matplotlib offers the following methods to control subplot spacing:
tight_layout(): Automatically adjusts subplot parameters to provide sufficient space for labels, titles, and other elements.subplots_adjust(): Manually adjusts spacing by specifying parameters likewspaceandhspace.
Examples
Example 1: Using tight_layout()
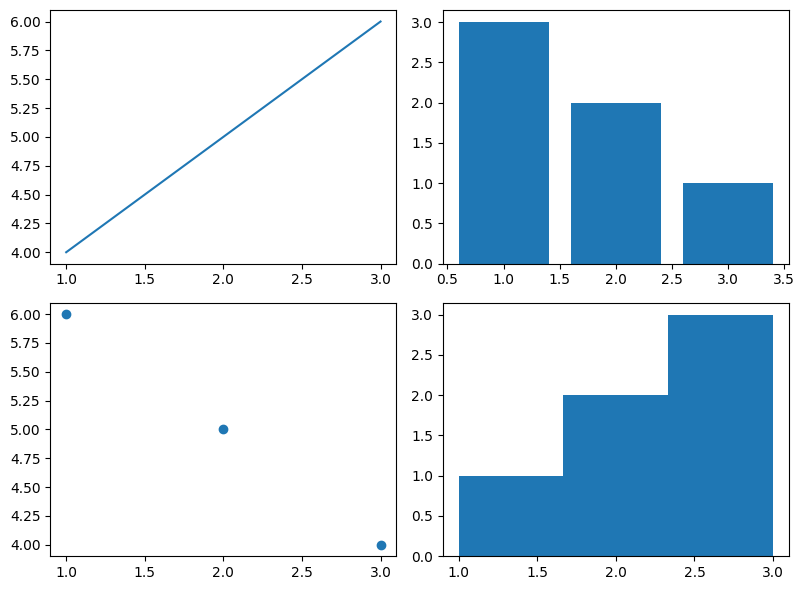
The tight_layout() method is an easy way to optimize spacing between subplots automatically.
import matplotlib.pyplot as plt

# Create a grid of subplots
fig, ax = plt.subplots(2, 2, figsize=(8, 6))

# Add data to each subplot
ax[0, 0].plot([1, 2, 3], [4, 5, 6])
ax[0, 1].bar([1, 2, 3], [3, 2, 1])
ax[1, 0].scatter([1, 2, 3], [6, 5, 4])
ax[1, 1].hist([1, 2, 2, 3, 3, 3], bins=3)

# Automatically adjust spacing
plt.tight_layout()

# Display the plot
plt.show()
Explanation
fig, ax = plt.subplots(2, 2, figsize=(8, 6))creates a 2x2 grid of subplots.- Each subplot contains a different type of plot (line, bar, scatter, histogram).
plt.tight_layout()automatically adjusts spacing to prevent overlapping of subplot elements.
Output

Example 2: Using subplots_adjust() for Manual Spacing
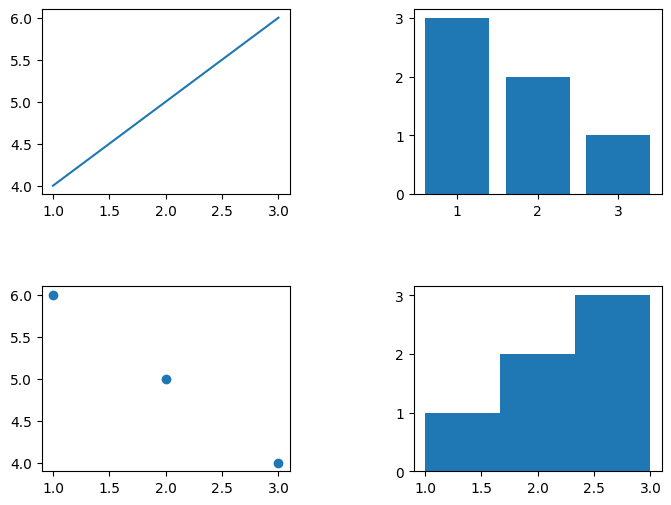
For finer control, use the subplots_adjust() method to specify parameters like horizontal and vertical spacing.
import matplotlib.pyplot as plt

# Create a grid of subplots
fig, ax = plt.subplots(2, 2, figsize=(8, 6))

# Add data to each subplot
ax[0, 0].plot([1, 2, 3], [4, 5, 6])
ax[0, 1].bar([1, 2, 3], [3, 2, 1])
ax[1, 0].scatter([1, 2, 3], [6, 5, 4])
ax[1, 1].hist([1, 2, 2, 3, 3, 3], bins=3)

# Manually adjust spacing
plt.subplots_adjust(wspace=0.5, hspace=0.5)

# Display the plot
plt.show()
Explanation
wspace: Specifies the amount of horizontal space between subplots (default is 0.2).hspace: Specifies the amount of vertical space between subplots (default is 0.2).- In this example,
wspace=0.5andhspace=0.5provide more spacing between subplots.
Output

Example 3: Combining Both Methods
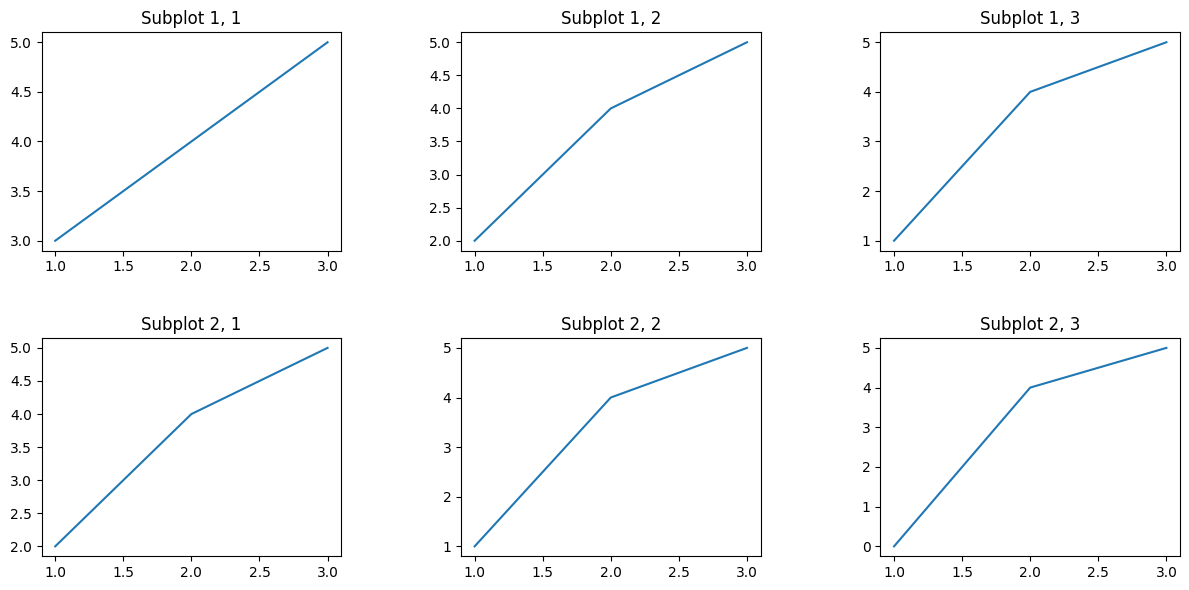
In some cases, combining tight_layout() and subplots_adjust() can produce optimal results.
import matplotlib.pyplot as plt

# Create a grid of subplots
fig, ax = plt.subplots(2, 3, figsize=(12, 6))

# Add data to each subplot
for i in range(2):
    for j in range(3):
        ax[i, j].plot([1, 2, 3], [3 - (i+j), 4, 5])
        ax[i, j].set_title(f'Subplot {i+1}, {j+1}')

# Use tight_layout to optimize spacing
plt.tight_layout()

# Add manual adjustments
plt.subplots_adjust(wspace=0.4, hspace=0.4)

# Display the plot
plt.show()
Explanation
plt.tight_layout()ensures that subplot elements do not overlap.plt.subplots_adjust(wspace=0.4, hspace=0.4)fine-tunes the spacing further to improve clarity.- The subplot titles are set dynamically for better identification.
Output

Summary
In this tutorial, you learned how to:
- Use
tight_layout()to automatically adjust subplot spacing. - Apply
subplots_adjust()for manual control over spacing. - Combine both methods for optimal subplot layout.
By mastering these techniques, you can create clear and visually appealing plots, even with complex layouts.