How to Add Legends to Subplots - Python Matplotlib
Legends in Matplotlib help to identify different plot elements like lines, bars, or scatter points. They are crucial for making your plots informative and readable, especially when multiple datasets are visualized in a single figure. In this tutorial, we'll learn how to add legends to individual subplots in a figure using Matplotlib.
Adding Legends to Subplots in Matplotlib
Legends can be added to subplots using the legend() method, which is typically called after plotting the data. Legends are added to each subplot independently, and you can customize their position and appearance.
The basic syntax for adding a legend to a subplot is:
ax.legend()
Here, ax refers to the axes object of the subplot.
Example 1: Adding a Legend to a Single Subplot
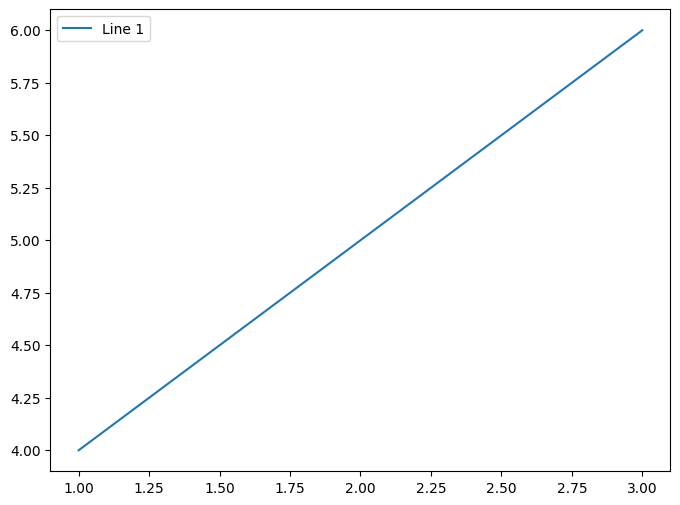
In this example, we will create a simple plot and add a legend to a single subplot.
import matplotlib.pyplot as plt

# Create a single subplot
fig, ax = plt.subplots(figsize=(8, 6))

# Plot data with labels for legend
ax.plot([1, 2, 3], [4, 5, 6], label='Line 1')

# Add a legend
ax.legend()

# Display the plot
plt.show()
Explanation
fig, ax = plt.subplots(figsize=(8, 6))creates a single subplot with a custom figure size.ax.plot([1, 2, 3], [4, 5, 6], label='Line 1')plots a line graph and labels it as 'Line 1' for the legend.ax.legend()adds the legend to the subplot, using the label provided during plotting.plt.show()displays the plot with the legend in place.
Output

Example 2: Adding Legends to Multiple Subplots
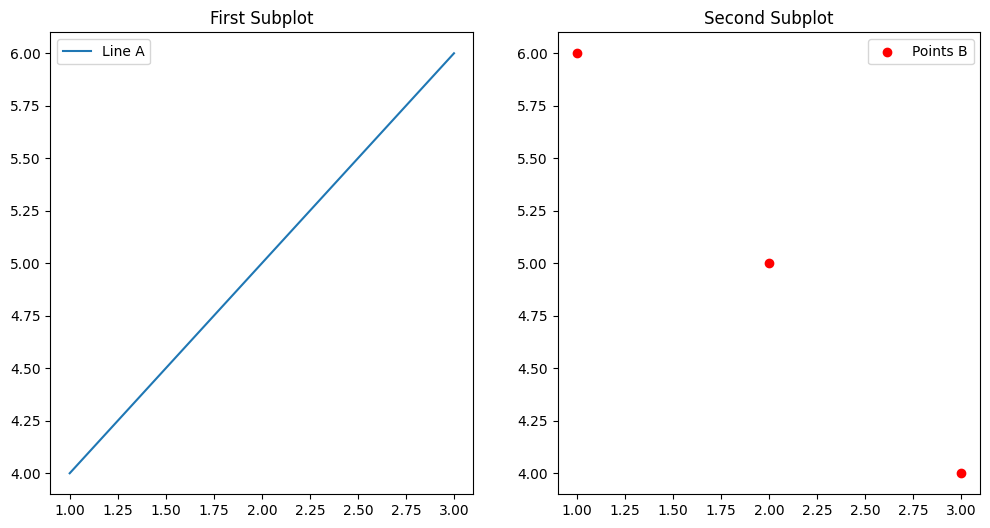
Now, let's create two subplots and add legends to both. Each subplot will have different data plotted with its own legend.
import matplotlib.pyplot as plt

# Create two subplots in a 1x2 grid
fig, ax = plt.subplots(1, 2, figsize=(12, 6))

# Plot on the first subplot with a legend
ax[0].plot([1, 2, 3], [4, 5, 6], label='Line A')
ax[0].legend()
ax[0].set_title('First Subplot')

# Plot on the second subplot with a different legend
ax[1].scatter([1, 2, 3], [6, 5, 4], color='r', label='Points B')
ax[1].legend()
ax[1].set_title('Second Subplot')

# Display the plot
plt.show()
Explanation
plt.subplots(1, 2, figsize=(12, 6))creates a 1x2 grid of subplots with a custom figure size.- In the first subplot, we plot a line and add a legend using
ax[0].legend(). - In the second subplot, we plot a scatter plot and add a different legend using
ax[1].legend(). plt.show()displays the figure with both subplots and their respective legends.
Output

Example 3: Customizing Legend Location in Subplots
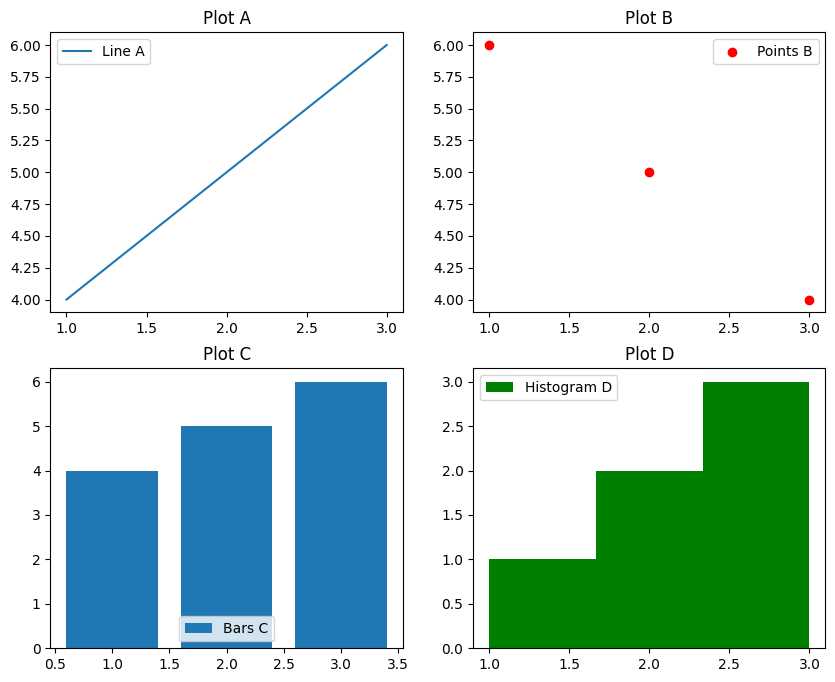
In this example, we'll customize the location of the legends in each subplot using the loc parameter of the legend() method.
import matplotlib.pyplot as plt

# Create a 2x2 grid of subplots
fig, ax = plt.subplots(2, 2, figsize=(10, 8))

# First subplot with legend at top left
ax[0, 0].plot([1, 2, 3], [4, 5, 6], label='Line A')
ax[0, 0].legend(loc='upper left')
ax[0, 0].set_title('Plot A')

# Second subplot with legend at top right
ax[0, 1].scatter([1, 2, 3], [6, 5, 4], color='r', label='Points B')
ax[0, 1].legend(loc='upper right')
ax[0, 1].set_title('Plot B')

# Third subplot with legend at bottom center
ax[1, 0].bar([1, 2, 3], [4, 5, 6], label='Bars C')
ax[1, 0].legend(loc='lower center')
ax[1, 0].set_title('Plot C')

# Fourth subplot with no legend
ax[1, 1].hist([1, 2, 2, 3, 3, 3], bins=3, color='g', label='Histogram D')
ax[1, 1].legend(loc='best')
ax[1, 1].set_title('Plot D')

# Display the plot
plt.show()
Explanation
loc='upper left',loc='upper right', andloc='lower center'are used to position the legends in different locations in each subplot.ax[1, 1].legend(loc='best')automatically positions the legend where it does not overlap with the plot.plt.show()displays the figure with four subplots, each having its own legend positioned according to the specified location.
Output

Summary
In this tutorial, you learned how to:
- Add legends to individual subplots using the
legend()method. - Customize the location of legends in subplots using the
locparameter. - Visualize multiple subplots with different types of plots and their corresponding legends.
Legends enhance the clarity of your visualizations, making them more informative for the viewer.