Python Matplotlib - Subplot Figure Size
How to Set Figure Size for Subplots in Matplotlib
In Matplotlib, you can control the size of your entire figure, as well as individual subplots. This is especially useful when working with multiple subplots in a single figure to ensure readability and proper layout. In this tutorial, we'll explore how to set the figure size and adjust it for subplots.
Setting Figure Size
The figsize parameter in plt.subplots() allows you to specify the size of the entire figure. The syntax is:
fig, ax = plt.subplots(nrows, ncols, figsize=(width, height))
Where width and height are the dimensions of the figure in inches.
Example 1: Basic Subplot with Custom Figure Size
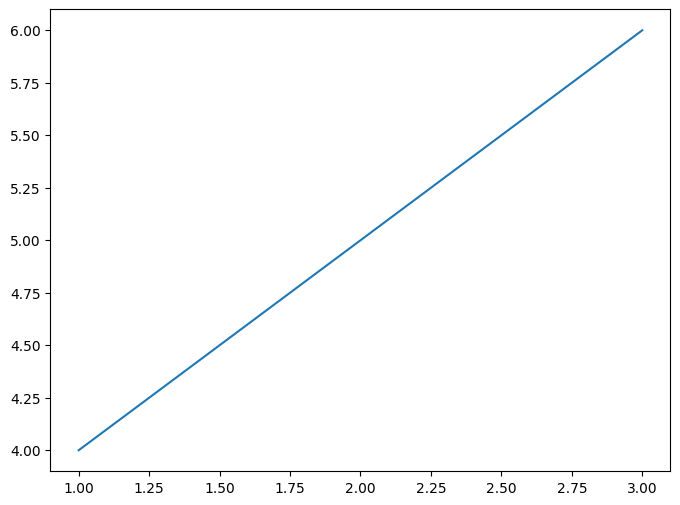
In this example, we’ll create a single subplot and adjust its figure size.
import matplotlib.pyplot as plt

# Create a subplot with a specific figure size
fig, ax = plt.subplots(figsize=(8, 6))

# Plot some data
ax.plot([1, 2, 3], [4, 5, 6])

# Display the plot
plt.show()
Explanation
plt.subplots(figsize=(8, 6))creates a figure with a width of 8 inches and a height of 6 inches.- The
ax.plot()method is used to plot a simple line graph. plt.show()displays the plot in a window with the specified figure size.
Output

Example 2: Multiple Subplots with Adjusted Figure Size
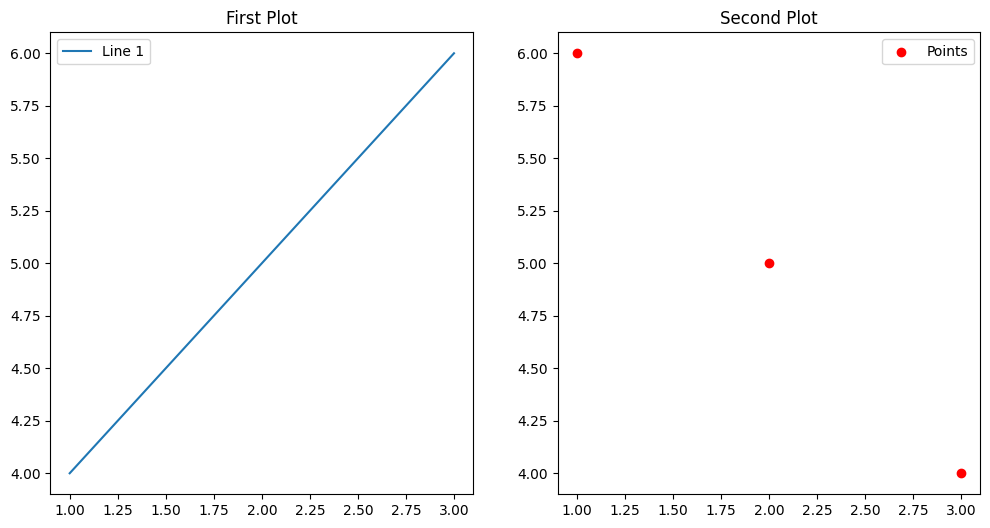
Next, let's create a figure with two subplots arranged in a 1x2 grid, and set a custom figure size for the entire figure.
import matplotlib.pyplot as plt

# Create a 1x2 grid of subplots with a larger figure size
fig, ax = plt.subplots(1, 2, figsize=(12, 6))

# Plot data on the first subplot
ax[0].plot([1, 2, 3], [4, 5, 6], label='Line 1')
ax[0].set_title('First Plot')
ax[0].legend()

# Plot data on the second subplot
ax[1].scatter([1, 2, 3], [6, 5, 4], label='Points', color='r')
ax[1].set_title('Second Plot')
ax[1].legend()

# Display the plot
plt.show()
Explanation
plt.subplots(1, 2, figsize=(12, 6))creates a figure with two subplots arranged in one row and two columns. The figure size is set to 12 inches wide and 6 inches tall.- The first subplot is a line plot, while the second subplot is a scatter plot. We set titles and legends for each subplot.
plt.show()displays the figure with both subplots having the same figure size.
Output

Example 3: Adjusting Layout and Figure Size for Multiple Subplots
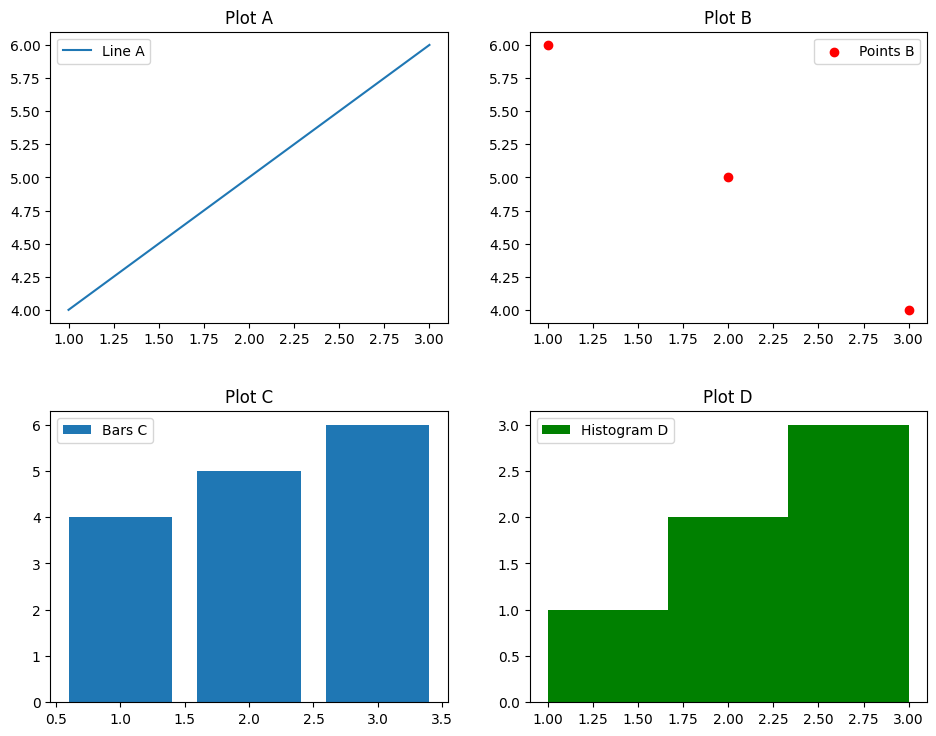
Now let's explore a more complex example with multiple subplots arranged in a 2x2 grid and the figure size adjusted to ensure proper spacing between them.
import matplotlib.pyplot as plt

# Create a 2x2 grid of subplots with a custom figure size
fig, ax = plt.subplots(2, 2, figsize=(10, 8))

# Plot data on each subplot
ax[0, 0].plot([1, 2, 3], [4, 5, 6], label='Line A')
ax[0, 0].set_title('Plot A')
ax[0, 0].legend()

ax[0, 1].scatter([1, 2, 3], [6, 5, 4], color='r', label='Points B')
ax[0, 1].set_title('Plot B')
ax[0, 1].legend()

ax[1, 0].bar([1, 2, 3], [4, 5, 6], label='Bars C')
ax[1, 0].set_title('Plot C')
ax[1, 0].legend()

ax[1, 1].hist([1, 2, 2, 3, 3, 3], bins=3, color='g', label='Histogram D')
ax[1, 1].set_title('Plot D')
ax[1, 1].legend()

# Adjust the layout for better spacing
plt.tight_layout(pad=3.0)

# Display the plot
plt.show()
Explanation
plt.subplots(2, 2, figsize=(10, 8))creates a figure with 2 rows and 2 columns of subplots. The figure size is set to 10 inches wide and 8 inches tall.- Each subplot is populated with different types of plots: line, scatter, bar, and histogram.
plt.tight_layout(pad=3.0)adjusts the spacing between the subplots for better readability by increasing the padding.plt.show()displays the final figure with all four subplots having the specified figure size and layout adjustments.
Output

Summary
In this tutorial, you learned how to:
- Set the figure size for a single subplot using the
figsizeparameter inplt.subplots(). - Adjust the figure size for multiple subplots arranged in a grid.
- Improve subplot layout using
plt.tight_layout()for better spacing between subplots.
By adjusting the figure size and layout, you can create clear and well-organized visualizations for your data.