Python Matplotlib Subplot Axis Labels - How to Label Axes in Subplots
Axis labels are essential for making plots more readable and informative. In Matplotlib, axis labels are added using the set_xlabel() and set_ylabel() methods, which allow you to customize the labels for both the x and y axes. This tutorial will show you how to add axis labels to subplots in a figure.
Adding Axis Labels to Subplots in Matplotlib
To label the axes of a subplot, you can use the set_xlabel() and set_ylabel() methods on the axes object. These methods let you specify custom labels for both the x-axis and the y-axis.
The basic syntax for adding axis labels is as follows:
ax.set_xlabel('X-axis Label')
ax.set_ylabel('Y-axis Label')
Here, ax refers to the axes object of the subplot.
Example 1: Adding Axis Labels to a Single Subplot
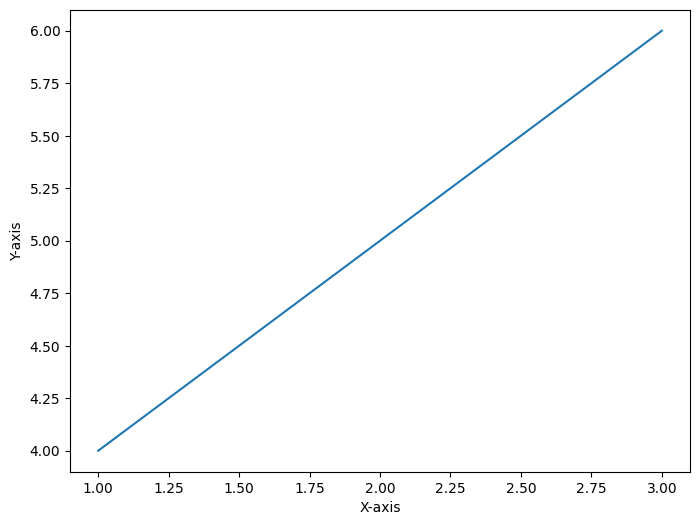
In this example, we will create a simple plot with custom axis labels for both the x and y axes.
import matplotlib.pyplot as plt

# Create a subplot
fig, ax = plt.subplots(figsize=(8, 6))

# Plot data
ax.plot([1, 2, 3], [4, 5, 6])

# Add axis labels
ax.set_xlabel('X-axis')
ax.set_ylabel('Y-axis')

# Display the plot
plt.show()
Explanation
fig, ax = plt.subplots(figsize=(8, 6))creates a single subplot with a custom figure size.ax.plot([1, 2, 3], [4, 5, 6])plots a line graph on the subplot.ax.set_xlabel('X-axis')adds a label to the x-axis, andax.set_ylabel('Y-axis')adds a label to the y-axis.plt.show()displays the plot with the axis labels in place.
Output

Example 2: Adding Axis Labels to Multiple Subplots
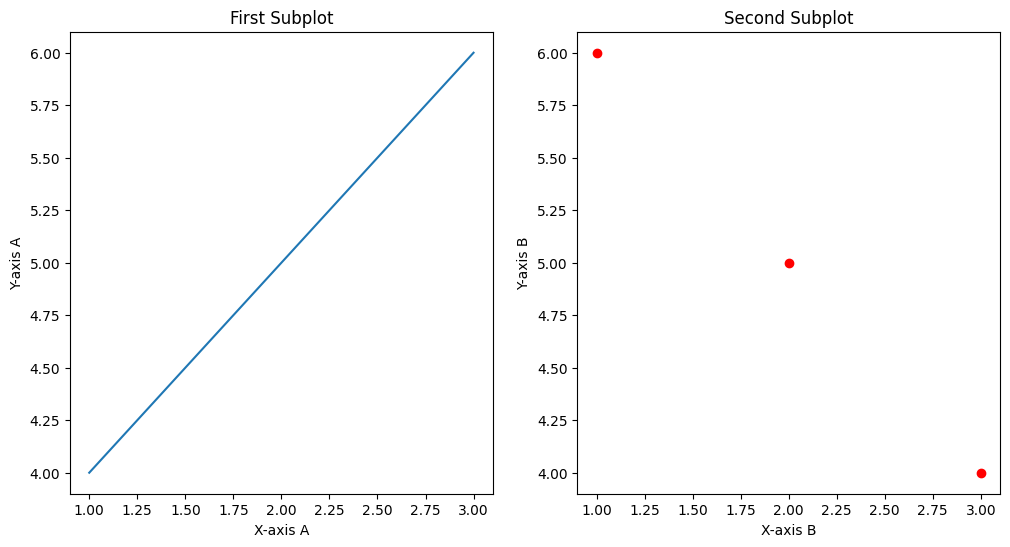
Now, let's create a figure with two subplots, and add axis labels to both subplots individually.
import matplotlib.pyplot as plt

# Create two subplots in a 1x2 grid
fig, ax = plt.subplots(1, 2, figsize=(12, 6))

# First subplot with axis labels
ax[0].plot([1, 2, 3], [4, 5, 6])
ax[0].set_xlabel('X-axis A')
ax[0].set_ylabel('Y-axis A')
ax[0].set_title('First Subplot')

# Second subplot with axis labels
ax[1].scatter([1, 2, 3], [6, 5, 4], color='r')
ax[1].set_xlabel('X-axis B')
ax[1].set_ylabel('Y-axis B')
ax[1].set_title('Second Subplot')

# Display the plot
plt.show()
Explanation
plt.subplots(1, 2, figsize=(12, 6))creates a 1x2 grid of subplots with a custom figure size.ax[0].plot([1, 2, 3], [4, 5, 6])creates a line plot on the first subplot, and axis labels are added usingax[0].set_xlabel()andax[0].set_ylabel().ax[1].scatter([1, 2, 3], [6, 5, 4], color='r')creates a scatter plot on the second subplot, with its own axis labels.plt.show()displays the figure with both subplots and their respective axis labels.
Output

Example 3: Customizing Axis Labels in Subplots
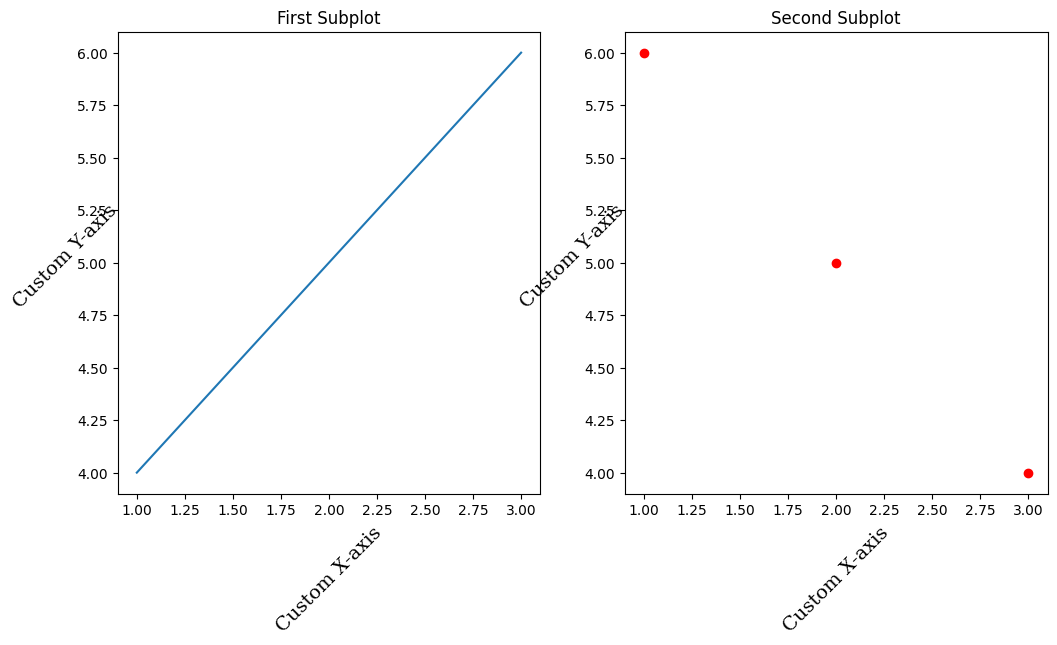
In this example, we will further customize the appearance of the axis labels by changing the font size, font family, and label rotation.
import matplotlib.pyplot as plt

# Create two subplots in a 1x2 grid
fig, ax = plt.subplots(1, 2, figsize=(12, 6))

# First subplot with custom axis labels
ax[0].plot([1, 2, 3], [4, 5, 6])
ax[0].set_xlabel('Custom X-axis', fontsize=14, fontfamily='serif', rotation=45)
ax[0].set_ylabel('Custom Y-axis', fontsize=14, fontfamily='serif', rotation=45)
ax[0].set_title('First Subplot')

# Second subplot with custom axis labels
ax[1].scatter([1, 2, 3], [6, 5, 4], color='r')
ax[1].set_xlabel('Custom X-axis', fontsize=14, fontfamily='serif', rotation=45)
ax[1].set_ylabel('Custom Y-axis', fontsize=14, fontfamily='serif', rotation=45)
ax[1].set_title('Second Subplot')

# Display the plot
plt.show()
Explanation
ax[0].set_xlabel('Custom X-axis', fontsize=14, fontfamily='serif', rotation=45)customizes the x-axis label by changing the font size, font family, and rotation angle.- Similarly,
ax[0].set_ylabel('Custom Y-axis', fontsize=14, fontfamily='serif', rotation=45)customizes the y-axis label. - These customizations are also applied to the second subplot.
plt.show()displays the figure with customized axis labels in both subplots.
Output

Summary
In this tutorial, you learned how to:
- Add axis labels to individual subplots using
set_xlabel()andset_ylabel(). - Customize the appearance of axis labels, including font size, family, and rotation.
- Label both the x and y axes in subplots, making your plots more informative and readable.
Axis labels are essential for understanding the data in your visualizations. By adding and customizing axis labels, you can make your plots more accessible and easier to interpret.