Python Matplotlib Stackplot - Modify Stacking Order
Python Matplotlib Stackplot - Modify Stacking Order
In a stack plot, the stacking order of datasets can significantly affect how data is visualized. Matplotlib's stackplot allows you to control this order by modifying the sequence of data passed to it.
This tutorial covers:
- Understanding the default stacking order in stack plots.
- Reordering datasets to customize the stacking order.
Default Stacking Order
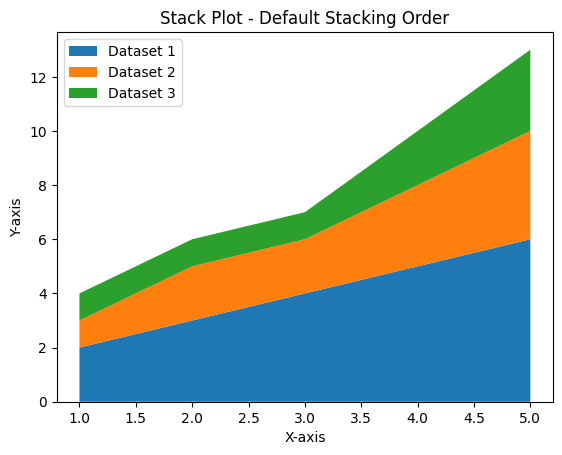
By default, Matplotlib stacks datasets in the order they are provided. The first dataset is plotted at the bottom, followed by subsequent datasets.
Example 1: Default Stacking Order
import matplotlib.pyplot as plt

# Data for the stack plot
x = [1, 2, 3, 4, 5]
y1 = [2, 3, 4, 5, 6]
y2 = [1, 2, 2, 3, 4]
y3 = [1, 1, 1, 2, 3]

# Create a stack plot with default order
plt.stackplot(x, y1, y2, y3, labels=['Dataset 1', 'Dataset 2', 'Dataset 3'])

# Add labels and title
plt.xlabel('X-axis')
plt.ylabel('Y-axis')
plt.title('Stack Plot - Default Stacking Order')

# Add a legend
plt.legend(loc='upper left')

# Show the plot
plt.show()
Explanation
- The datasets are stacked in the order
y1,y2, andy3. - The first dataset (
y1) forms the base, with subsequent datasets stacked on top.

Reordering Datasets
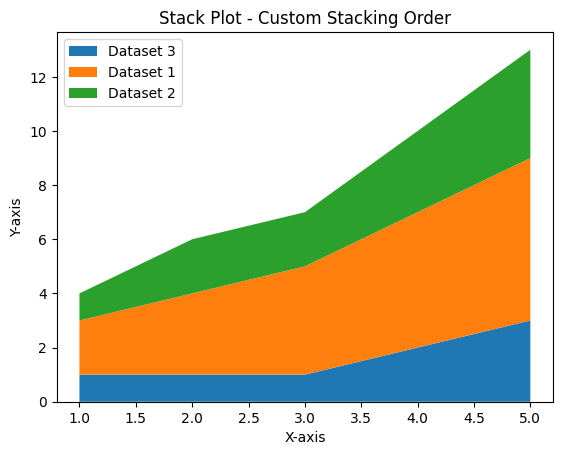
You can modify the stacking order by rearranging the datasets before passing them to plt.stackplot().
Example 2: Custom Stacking Order
import matplotlib.pyplot as plt

# Data for the stack plot
x = [1, 2, 3, 4, 5]
y1 = [2, 3, 4, 5, 6]
y2 = [1, 2, 2, 3, 4]
y3 = [1, 1, 1, 2, 3]

# Reorder datasets (e.g., move y3 to the base)
plt.stackplot(x, y3, y1, y2, labels=['Dataset 3', 'Dataset 1', 'Dataset 2'])

# Add labels and title
plt.xlabel('X-axis')
plt.ylabel('Y-axis')
plt.title('Stack Plot - Custom Stacking Order')

# Add a legend
plt.legend(loc='upper left')

# Show the plot
plt.show()
Explanation
- The order of the datasets is modified to
y3,y1, andy2. y3forms the base, and other datasets are stacked on top.

Using Reordered Labels and Colors
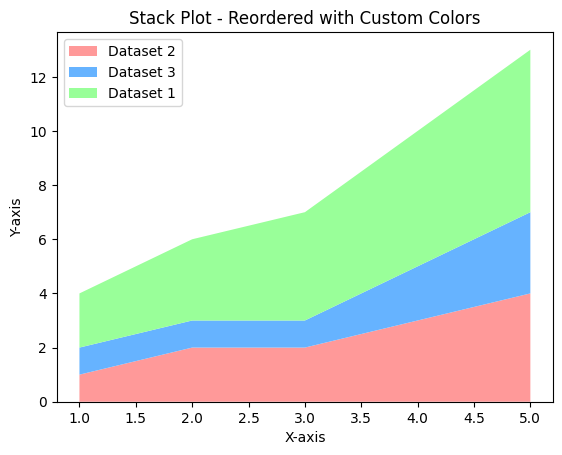
To make reordering clear, you can use custom labels and colors that reflect the modified order.
Example 3: Stack Plot with Reordered Colors and Labels
import matplotlib.pyplot as plt

# Data for the stack plot
x = [1, 2, 3, 4, 5]
y1 = [2, 3, 4, 5, 6]
y2 = [1, 2, 2, 3, 4]
y3 = [1, 1, 1, 2, 3]

# Custom colors
colors = ['#ff9999', '#66b3ff', '#99ff99']

# Reorder datasets and apply custom colors
plt.stackplot(x, y2, y3, y1, labels=['Dataset 2', 'Dataset 3', 'Dataset 1'], colors=colors)

# Add labels and title
plt.xlabel('X-axis')
plt.ylabel('Y-axis')
plt.title('Stack Plot - Reordered with Custom Colors')

# Add a legend
plt.legend(loc='upper left')

# Show the plot
plt.show()
Explanation
- The datasets are reordered to
y2,y3, andy1. - Custom colors are applied to each dataset for better differentiation.
- The legend reflects the reordered datasets.

Summary
In this tutorial, we explored:
- The default stacking order in Matplotlib stack plots.
- How to reorder datasets to modify the stacking order.
- Applying custom labels and colors to emphasize the new order.
By customizing the stacking order, you can create stack plots that better convey your data's story and focus on the most important aspects.