Python Matplotlib Stackplot Line Style
Python Matplotlib Stackplot - Line Style
Stackplots in Matplotlib are often used to visualize cumulative data. By customizing the line styles in a stackplot, you can enhance the readability and aesthetics of your chart. This tutorial demonstrates how to apply various line styles, such as solid, dashed, and dotted lines, to the edges of stacked areas in a stackplot.
What is Line Style in Stackplot?
The line style in a stackplot determines the appearance of the edges of the stacked areas. By default, the lines are solid, but Matplotlib allows you to customize them using parameters like linestyle and edgecolor.
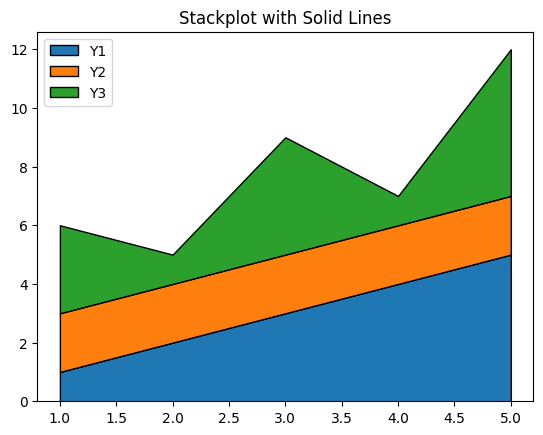
Example 1: Basic Stackplot with Solid Lines
import matplotlib.pyplot as plt
import numpy as np

# Data preparation
x = np.arange(1, 6)
y1 = [1, 2, 3, 4, 5]
y2 = [2, 2, 2, 2, 2]
y3 = [3, 1, 4, 1, 5]

# Create stackplot
plt.stackplot(x, y1, y2, y3, labels=['Y1', 'Y2', 'Y3'], edgecolor='black', linestyle='solid')

# Add legend and title
plt.legend(loc='upper left')
plt.title('Stackplot with Solid Lines')

# Show plot
plt.show()
Explanation
- The
edgecolorparameter is set to'black'to define the color of the lines around the stacked areas. - The
linestyleparameter is set to'solid', which is the default style for stackplot edges. - Labels are added to each stack for clarity.

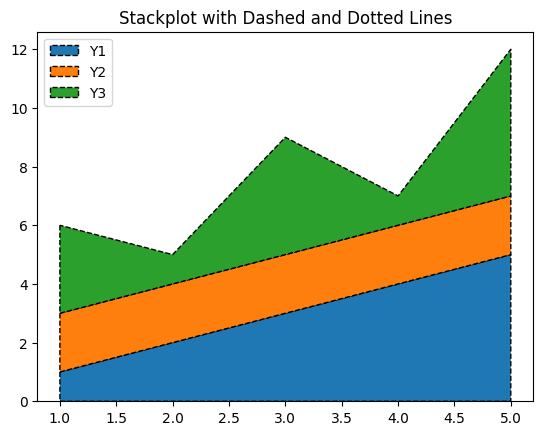
Example 2: Stackplot with Dashed and Dotted Lines
import matplotlib.pyplot as plt
import numpy as np

# Data preparation
x = np.arange(1, 6)
y1 = [1, 2, 3, 4, 5]
y2 = [2, 2, 2, 2, 2]
y3 = [3, 1, 4, 1, 5]

# Create stackplot with customized line styles
plt.stackplot(x, y1, y2, y3, labels=['Y1', 'Y2', 'Y3'],
              edgecolor='black', linestyle=['--'])

# Add legend and title
plt.legend(loc='upper left')
plt.title('Stackplot with Dashed and Dotted Lines')

# Show plot
plt.show()
Explanation
- The
linestyleparameter is passed a list of styles:'--'for dashed. - Each stacked area uses a different line style to improve differentiation.
- The
edgecolorparameter ensures the edges are clearly visible.

Summary
In this tutorial, we explored:
- How to apply line styles to the edges of stacked areas in a stackplot.
- Customizing line styles, such as solid, dashed, and dotted, using the
linestyleparameter. - Enhancing clarity by combining edge colors and line styles.
By leveraging these customizations, you can create stackplots that are both informative and visually appealing.