Python Matplotlib Stackplot - Adding Labels to Stacks
Python Matplotlib Stackplot - Adding Labels to Stacks
Adding labels to stack plots in Matplotlib enhances clarity by identifying individual stack contributions. This tutorial demonstrates how to add labels directly to stacks for better visualization and understanding of data proportions.
We will cover:
- Basic stack plot with labels.
- Customizing label positions and appearance.
Basic Stack Plot with Labels
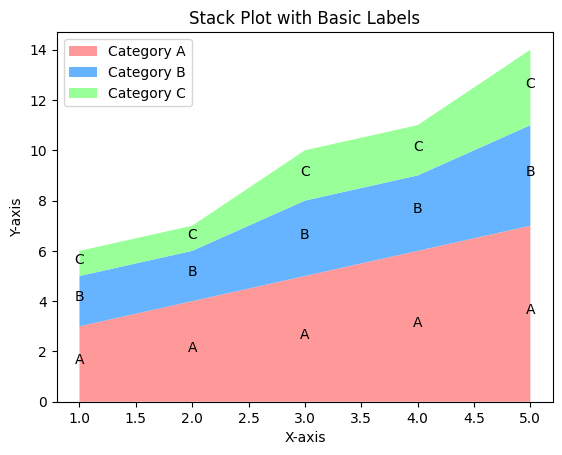
You can use the plt.text() function to manually add labels to specific positions on a stack plot.
Example 1: Adding Basic Labels
import matplotlib.pyplot as plt

# Data for the stack plot
x = [1, 2, 3, 4, 5]
y1 = [3, 4, 5, 6, 7]
y2 = [2, 2, 3, 3, 4]
y3 = [1, 1, 2, 2, 3]

# Create stack plot
plt.stackplot(x, y1, y2, y3, labels=['Category A', 'Category B', 'Category C'], colors=['#ff9999', '#66b3ff', '#99ff99'])

# Add labels to stacks
for i, value in enumerate(y1):
    plt.text(x[i], value / 2, 'A', ha='center', fontsize=10, color='black')
for i, value in enumerate(y2):
    plt.text(x[i], y1[i] + value / 2, 'B', ha='center', fontsize=10, color='black')
for i, value in enumerate(y3):
    plt.text(x[i], y1[i] + y2[i] + value / 2, 'C', ha='center', fontsize=10, color='black')

# Add title, legend, and labels
plt.title('Stack Plot with Basic Labels')
plt.xlabel('X-axis')
plt.ylabel('Y-axis')
plt.legend(loc='upper left')

# Show the plot
plt.show()
Explanation
- The
plt.text()function places labels at specific positions within each stack. - The position of each label is calculated using cumulative sums of stack heights to ensure proper placement.
- Font size and color are customized for readability.

Customizing Label Positions
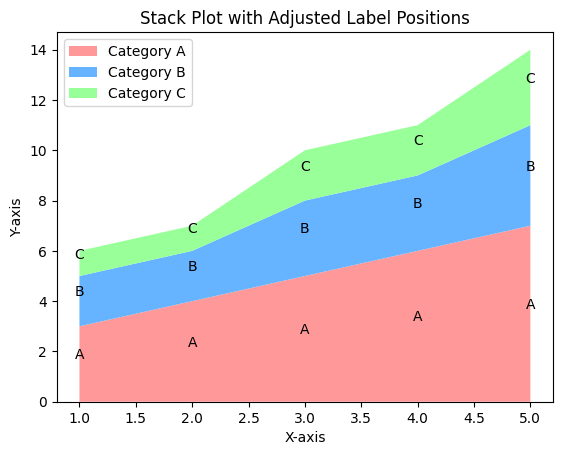
Label positions can be adjusted to avoid overlap and improve visual clarity by fine-tuning the plt.text() function.
Example 2: Adjusting Label Positions
import matplotlib.pyplot as plt

# Data for the stack plot
x = [1, 2, 3, 4, 5]
y1 = [3, 4, 5, 6, 7]
y2 = [2, 2, 3, 3, 4]
y3 = [1, 1, 2, 2, 3]

# Create stack plot
plt.stackplot(x, y1, y2, y3, labels=['Category A', 'Category B', 'Category C'], colors=['#ff9999', '#66b3ff', '#99ff99'])

# Add adjusted labels
for i, value in enumerate(y1):
    plt.text(x[i], value / 2 + 0.2, 'A', ha='center', fontsize=10, color='black')
for i, value in enumerate(y2):
    plt.text(x[i], y1[i] + value / 2 + 0.2, 'B', ha='center', fontsize=10, color='black')
for i, value in enumerate(y3):
    plt.text(x[i], y1[i] + y2[i] + value / 2 + 0.2, 'C', ha='center', fontsize=10, color='black')

# Add title, legend, and labels
plt.title('Stack Plot with Adjusted Label Positions')
plt.xlabel('X-axis')
plt.ylabel('Y-axis')
plt.legend(loc='upper left')

# Show the plot
plt.show()
Explanation
- Label positions are adjusted by adding an offset (e.g.,
+0.2) to the calculated positions. - This ensures labels do not overlap with stack boundaries or other labels.
- The adjustments improve visual clarity without compromising data representation.

Using Annotations for Labels
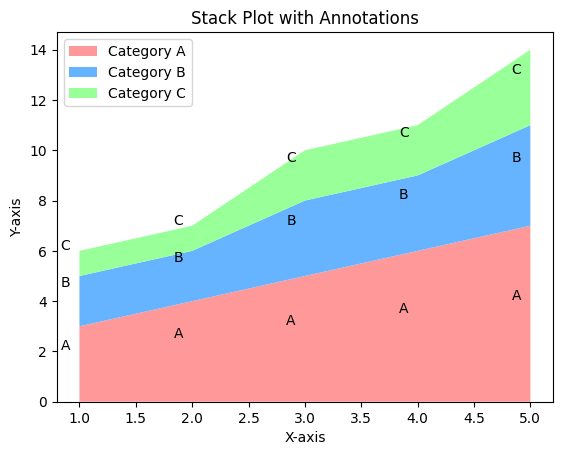
Matplotlib annotations allow for more flexibility in labeling, including arrows and precise positioning.
Example 3: Adding Labels with Annotations
import matplotlib.pyplot as plt

# Data for the stack plot
x = [1, 2, 3, 4, 5]
y1 = [3, 4, 5, 6, 7]
y2 = [2, 2, 3, 3, 4]
y3 = [1, 1, 2, 2, 3]

# Create stack plot
plt.stackplot(x, y1, y2, y3, labels=['Category A', 'Category B', 'Category C'], colors=['#ff9999', '#66b3ff', '#99ff99'])

# Add annotations
for i, value in enumerate(y1):
    plt.annotate('A', (x[i], value / 2), textcoords="offset points", xytext=(-10, 10), ha='center', color='black')
for i, value in enumerate(y2):
    plt.annotate('B', (x[i], y1[i] + value / 2), textcoords="offset points", xytext=(-10, 10), ha='center', color='black')
for i, value in enumerate(y3):
    plt.annotate('C', (x[i], y1[i] + y2[i] + value / 2), textcoords="offset points", xytext=(-10, 10), ha='center', color='black')

# Add title, legend, and labels
plt.title('Stack Plot with Annotations')
plt.xlabel('X-axis')
plt.ylabel('Y-axis')
plt.legend(loc='upper left')

# Show the plot
plt.show()
Explanation
plt.annotate()adds labels with additional customization options, such as offsets and arrows.- The
xytextparameter adjusts label placement relative to the data point. - Annotations offer precise control over label positioning and appearance.

Summary
In this tutorial, we covered:
- Adding basic labels to stacks using
plt.text(). - Adjusting label positions to improve readability.
- Using annotations for flexible and precise labeling.
By adding labels, you can enhance the interpretability of your stack plots and provide a clearer picture of the data.