Python Matplotlib - Stacked Bar Plots
Python Matplotlib - Stacked Bar Plots
Stacked bar plots are a great way to visualize the contribution of different components to a total. In Python, Matplotlib makes it easy to create and customize stacked bar charts. This tutorial explores how to create and enhance stacked bar plots with examples and detailed explanations.
Creating a Basic Stacked Bar Plot
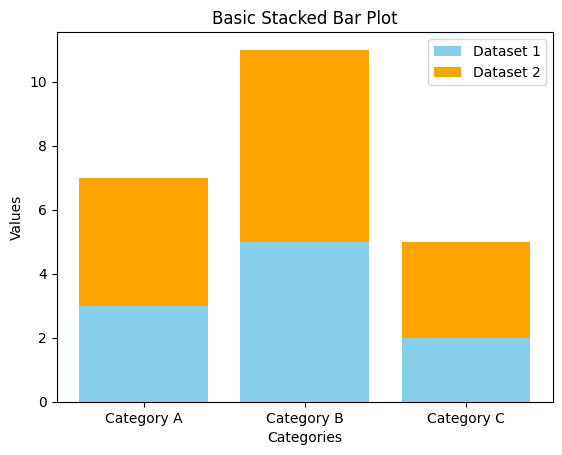
In a stacked bar plot, bars are divided into segments to represent multiple datasets stacked on top of each other.
Example 1: Basic Stacked Bar Plot
import matplotlib.pyplot as plt
import numpy as np

# Data for the stacked bar plot
categories = ['Category A', 'Category B', 'Category C']
values1 = [3, 5, 2]
values2 = [4, 6, 3]

# Bar positions
x = np.arange(len(categories))

# Create the stacked bar plot
plt.bar(x, values1, label='Dataset 1', color='skyblue')
plt.bar(x, values2, bottom=values1, label='Dataset 2', color='orange')

# Add labels, title, and legend
plt.xticks(x, categories)
plt.xlabel('Categories')
plt.ylabel('Values')
plt.title('Basic Stacked Bar Plot')
plt.legend()

# Show the plot
plt.show()
Explanation
plt.bar()creates bars forvalues1at positionsx.- The
bottomparameter stacksvalues2on top ofvalues1. xticksmaps the bar positions to category labels.

Customizing Stacked Bar Plots
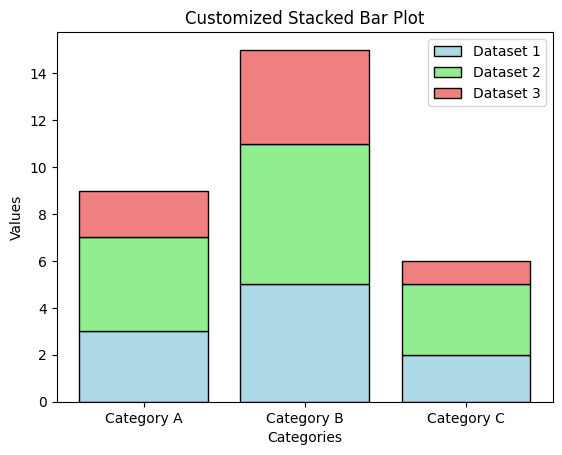
Matplotlib allows extensive customization of stacked bar plots to improve aesthetics and readability.
Example 2: Customized Stacked Bar Plot
import matplotlib.pyplot as plt
import numpy as np

# Data for the stacked bar plot
categories = ['Category A', 'Category B', 'Category C']
values1 = [3, 5, 2]
values2 = [4, 6, 3]
values3 = [2, 4, 1]

# Bar positions
x = np.arange(len(categories))

# Create the stacked bar plot with custom styles
plt.bar(x, values1, label='Dataset 1', color='lightblue', edgecolor='black')
plt.bar(x, values2, bottom=values1, label='Dataset 2', color='lightgreen', edgecolor='black')
plt.bar(x, values3, bottom=np.array(values1) + np.array(values2), label='Dataset 3', color='lightcoral', edgecolor='black')

# Add labels, title, and legend
plt.xticks(x, categories)
plt.xlabel('Categories')
plt.ylabel('Values')
plt.title('Customized Stacked Bar Plot')
plt.legend()

# Show the plot
plt.show()
Explanation
- Additional dataset
values3is stacked using the cumulative sum ofvalues1andvalues2. edgecoloradds a border to the bars for better distinction.- Colors are customized for improved visualization.

Grouped Stacked Bar Plots
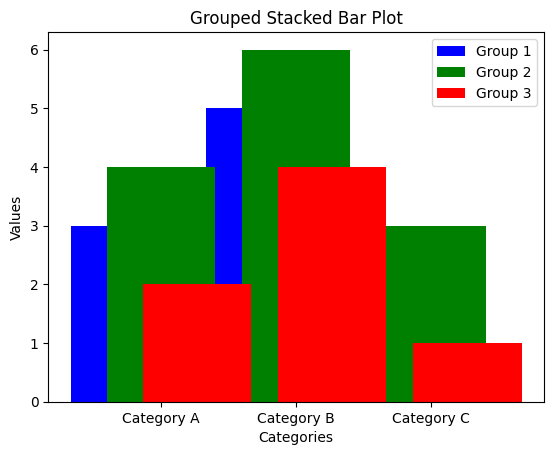
You can create grouped stacked bar plots to compare multiple groups within each category.
Example 3: Grouped Stacked Bar Plot
import matplotlib.pyplot as plt
import numpy as np

# Data for the grouped stacked bar plot
categories = ['Category A', 'Category B', 'Category C']
values_group1 = [3, 5, 2]
values_group2 = [4, 6, 3]
values_group3 = [2, 4, 1]

group_width = 0.8  # Total width of each group
bar_width = group_width / 3  # Width of each individual bar

# Bar positions for each group
x = np.arange(len(categories))
x_group1 = x - bar_width
x_group2 = x
x_group3 = x + bar_width

# Create the grouped stacked bar plot
plt.bar(x_group1, values_group1, label='Group 1', color='blue')
plt.bar(x_group2, values_group2, label='Group 2', color='green')
plt.bar(x_group3, values_group3, label='Group 3', color='red')

# Add labels, title, and legend
plt.xticks(x, categories)
plt.xlabel('Categories')
plt.ylabel('Values')
plt.title('Grouped Stacked Bar Plot')
plt.legend()

# Show the plot
plt.show()
Explanation
group_widthdetermines the total width of the bars in a group, andbar_widthdivides it among individual bars.- Bar positions are calculated separately for each group using
xand offsets. - Each group is styled and labeled distinctly for clarity.

Summary
In this tutorial, we covered:
- Creating basic stacked bar plots using Matplotlib.
- Customizing stacked bar plots for better aesthetics.
- Designing grouped stacked bar plots for comparative analysis.
Stacked bar plots are versatile tools for visualizing data distributions and comparisons across multiple categories. Explore these techniques to make your data more insightful and visually appealing.