Python Matplotlib - Bar Plot - Sort Descending
Python Matplotlib - Bar Plot - Sort Descending
Sorting a bar plot in descending order can make your data visualization more effective by highlighting the most significant values. In this tutorial, we will cover how to sort bar plots in descending order using Python's Matplotlib library.
Sorting Data for Bar Plot
To create a bar plot in descending order, the data must first be sorted. You can use Python's sorted() function or Pandas library for sorting.
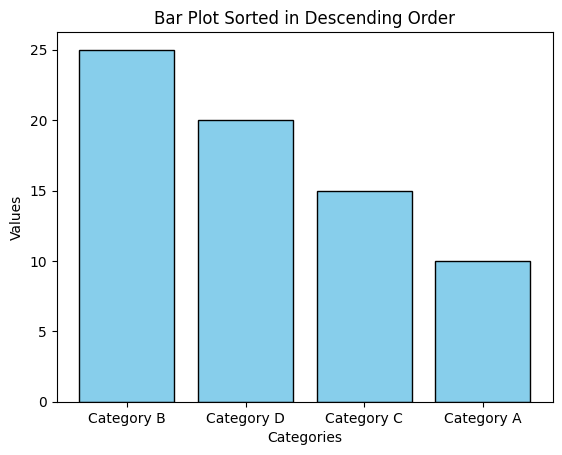
Example 1: Sorting Using sorted()
import matplotlib.pyplot as plt

# Data for the bar plot
categories = ['Category A', 'Category B', 'Category C', 'Category D']
values = [10, 25, 15, 20]

# Sort the data in descending order
sorted_data = sorted(zip(values, categories), reverse=True)
sorted_values, sorted_categories = zip(*sorted_data)

# Create the bar plot
plt.bar(sorted_categories, sorted_values, color='skyblue', edgecolor='black')

# Add labels and title
plt.xlabel('Categories')
plt.ylabel('Values')
plt.title('Bar Plot Sorted in Descending Order')

# Show the plot
plt.show()
Explanation
- The
zip()function combines values and categories into pairs. - The
sorted()function sorts the data in descending order usingreverse=True. - The sorted data is unpacked into
sorted_valuesandsorted_categoriesfor plotting.

Sorting Data Using Pandas
If your data is in a Pandas DataFrame, sorting can be done directly using the sort_values() method.
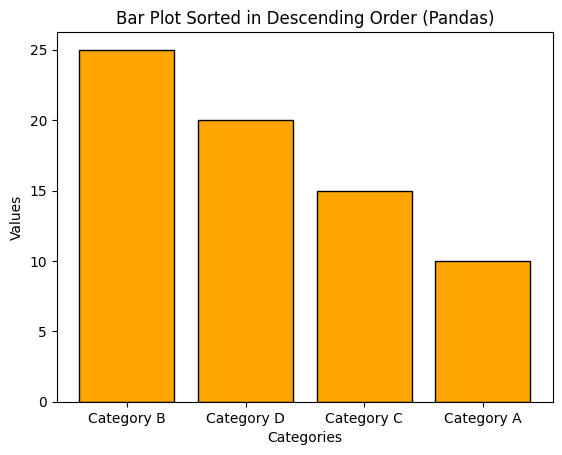
Example 2: Sorting Using Pandas
import matplotlib.pyplot as plt
import pandas as pd

# Create a DataFrame
data = {'Categories': ['Category A', 'Category B', 'Category C', 'Category D'],
        'Values': [10, 25, 15, 20]}
df = pd.DataFrame(data)

# Sort the DataFrame in descending order by 'Values'
df_sorted = df.sort_values('Values', ascending=False)

# Create the bar plot
plt.bar(df_sorted['Categories'], df_sorted['Values'], color='orange', edgecolor='black')

# Add labels and title
plt.xlabel('Categories')
plt.ylabel('Values')
plt.title('Bar Plot Sorted in Descending Order (Pandas)')

# Show the plot
plt.show()
Explanation
- The data is stored in a Pandas DataFrame for easy manipulation.
- The
sort_values()method sorts the DataFrame by the 'Values' column in descending order. - The sorted DataFrame is used to create the bar plot.

Customizing Sorted Bar Plot
After sorting, you can further customize the bar plot by changing colors, adding gridlines, and formatting labels.
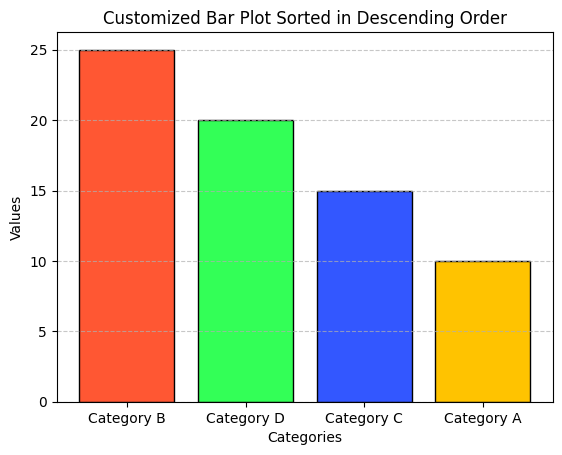
Example 3: Customized Sorted Bar Plot
import matplotlib.pyplot as plt

# Data for the bar plot
categories = ['Category A', 'Category B', 'Category C', 'Category D']
values = [10, 25, 15, 20]

# Sort the data in descending order
sorted_data = sorted(zip(values, categories), reverse=True)
sorted_values, sorted_categories = zip(*sorted_data)

# Create the bar plot
plt.bar(sorted_categories, sorted_values, color=['#FF5733', '#33FF57', '#3357FF', '#FFC300'], edgecolor='black')

# Add labels and title
plt.xlabel('Categories')
plt.ylabel('Values')
plt.title('Customized Bar Plot Sorted in Descending Order')

# Add gridlines
plt.grid(axis='y', linestyle='--', alpha=0.7)

# Show the plot
plt.show()
Explanation
- Each bar is assigned a unique color using a list of hex color codes.
- Gridlines are added to the y-axis for better visual reference using
plt.grid(). - The sorted data is displayed in a visually enhanced bar plot.

Summary
In this tutorial, we covered:
- Sorting bar plot data in descending order using
sorted()and Pandas. - Creating bar plots with sorted data.
- Customizing bar plots to improve aesthetics and readability.
Sorting bar plots helps emphasize the most significant data points and makes visualizations more intuitive. Experiment with these techniques to enhance your data presentations.