Matplotlib - Subplot with one row and two columns
Matplotlib - Subplot with one row and two columns
First let us see the syntax of subplot() function, and then using this information, we shall create subplot with one row and two columns.
The syntax of subplot function is
subplot(crows, cols, index, **kwargs)where
| Parameter | Description |
|---|---|
| nrows | Number of rows of subplots. |
| ncols | Number of columns of subplots. |
| index | Integer or tuple representing the index of the current subplot. Starts from 1. |
| **kwargs | Additional keyword arguments passed to the `add_subplot` call (optional). |
Therefore, to create subplot with one row and two columns,
- The first subplot should be
plt.subplot(1, 2, 1)where the first argument1specifies that there is one row, the second argument2specifies that there are two columns, and the third argument1specifies that this subplot is the first. - The second subplot should be
plt.subplot(1, 2, 2)where the first argument1specifies that there is one row, the second argument2specifies that there are two columns, and the third argument2specifies that this subplot is the second.
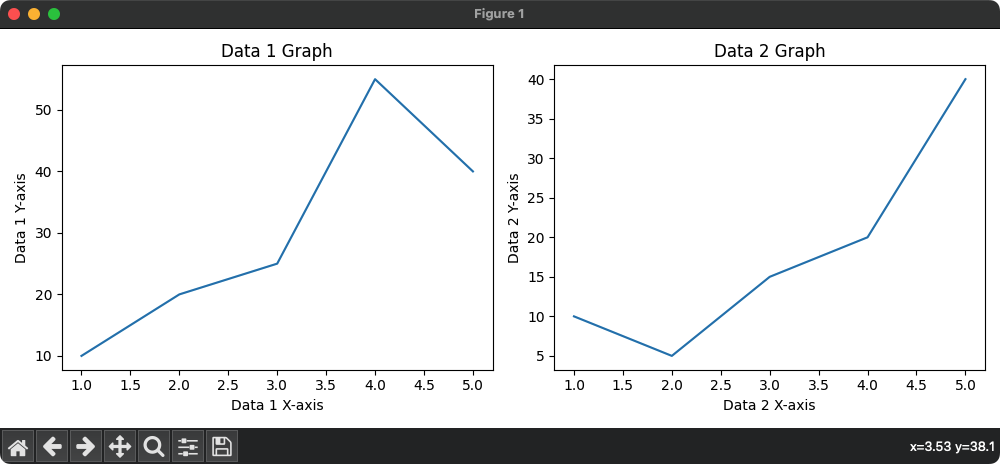
For example, consider the following program where we create subplot in a row with two columns.
Python Program
import matplotlib.pyplot as plt

# Example data
x = [1, 2, 3, 4, 5]
y1 = [10, 20, 25, 55, 40]
y2 = [10, 5, 15, 20, 40]

# Create a figure with two subplots (1 row, 2 columns)
plt.figure(figsize=(10, 4))

# Subplot 1 (left)
plt.subplot(1, 2, 1)
plt.plot(x, y1)
plt.title('Data 1 Graph')
plt.xlabel('Data 1 X-axis')
plt.ylabel('Data 1 Y-axis')

# Subplot 2 (right)
plt.subplot(1, 2, 2)
plt.plot(x, y2)
plt.title('Data 2 Graph')
plt.xlabel('Data 2 X-axis')
plt.ylabel('Data 2 Y-axis')

# Adjust layout for better spacing
plt.tight_layout()

# Show the plot
plt.show()
Output
