Matplotlib - Plot Dashdot Line
Matplotlib - Plot Dashdot Line Tutorial
In this tutorial, we'll create a simple plot with a dashdot line using Matplotlib in Python.

1. Import Matplotlib.pyplot
Import the Matplotlib library, specifically the pyplot module.
import matplotlib.pyplot as plt2. Create Data
Define the data points for the X and Y axes.
x = [1, 2, 3, 4, 5]
y = [20, 30, 55, 70, 60]
In this case, x represents the values on the X-axis, and y represents the corresponding values on the Y-axis.
3. Plot Dashdot Line
Use Matplotlib to plot a dashdot line.
plt.plot(x, y, linestyle='dashdot', marker='o')linestyle: This parameter determines the style of the line in the plot.
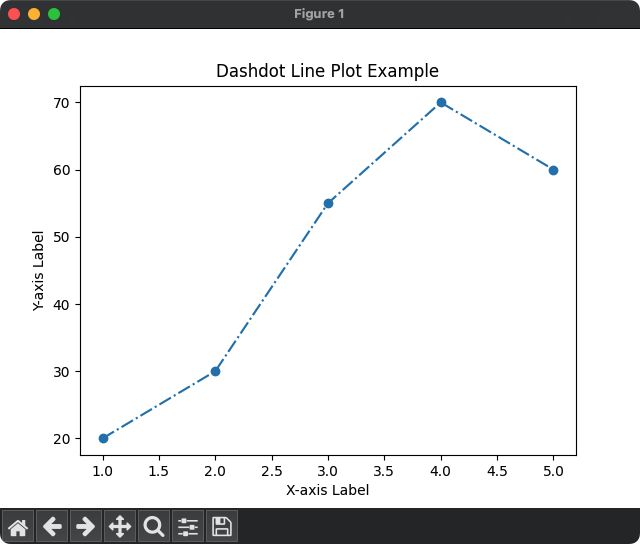
When you set linestyle='dashdot', it indicates that the line connecting the data points will be represented as a series of dash-dot symbols.
4. Customize and show the plot
Customize the plot with labels and titles, and then show the plot in a figure.
plt.title('Dashdot Line Plot Example')
plt.xlabel('X-axis Label')
plt.ylabel('Y-axis Label')
plt.show()
Complete program to plot Dashdot line using Matplotlib
Using all the above steps, let us write the complete program to draw a dashdot line using Matplotlib plot() function.
Python Program
import matplotlib.pyplot as plt

# Example data
x = [1, 2, 3, 4, 5]
y = [20, 30, 55, 70, 60]

# Plot dashdot line
plt.plot(x, y, linestyle='dashdot', marker='o')

# Customize plot
plt.title('Dashdot Line Plot Example')
plt.xlabel('X-axis Label')
plt.ylabel('Y-axis Label')

# Show the plot
plt.show()
Output

Summary
That concludes our tutorial on creating a plot with a dashdot line using Matplotlib in Python!